「Highchartsを使用した環境データの表示」ですでにHighchartsによりチャートを表示しました。今回は再度Highchartsを使ってチャートを表示します。
Highchartsを使ったチャートのコードの作成
Highchartsを使ったチャートのコードを次に示します。
- 185行目でgetJSON関数を実行して、表示するデータを取得します。
- 168-183行目は、getJSON関数で渡すパラメータを作成します。
index.html
<!doctype html>
<html lang="ja">
  <head>
    <meta http-equiv="Content-Type" content="text/html; charset=utf-8">
    <title>気象データ in 横浜</title>
    <script type="text/javascript" src="http://ajax.googleapis.com/ajax/libs/jquery/1.10.2/jquery.min.js"></script>
    <script src="http://code.highcharts.com/highcharts.js"></script>
    <script src="http://code.highcharts.com/modules/exporting.js"></script>
    <script>
      $(function () {
        var name = "hoge";
        var options = {
          chart: {
            renderTo: 'container',
                    type: 'spline',
            zoomType: 'x'
          },
          title: {
            text: '気象データ in 横浜'
          },
          subtitle: {
            text: '提供: TomoSoft(https://tomosoft.jp/design/)'
          },
          credits: {
            enabled: false
          },
          xAxis: [{
              title: {
                text: '時刻',
              },
              categories: ['00:00', '01:00', '02:00', '03:00', '04:00', '05:00',
                '06:00', '07:00', '08:00', '09:00', '10:00', '11:00', '12:00', '13:00', '14:00', '15:00', '16:00',
                '17:00', '18:00', '19:00', '20:00', '21:00', '22:00', '23:00'],
              crosshair: true
            }],
          yAxis: [{// Primary yAxis
              title: {
                text: '気温',
                style: {
                  color: '#228B22', //ForestGreen
                }
              },
              labels: {
                format: '{value}℃',
                style: {
                  color: '#228B22',
                }
              },
              ceiling: 35,
              floor: -10

            }, {// Secondary yAxis
              gridLineWidth: 0,
              title: {
                text: '湿度',
                style: {
                  color: '#4169E1', //RoyalBlue
                }
              },
              labels: {
                format: '{value} %',
                style: {
                  color: '#4169E1',
                }
              },
              ceiling: 90,
              floor: 40,
              opposite: true

            }, {// Tertiary yAxis
              gridLineWidth: 0,
              title: {
                text: '気圧',
                style: {
                  color: '#DAA520', // GoldenRod
                }
              },
              labels: {
                format: '{value} hPa',
                style: {
                  color: '#DAA520',
                }
              },
              ceiling: 1030,
              floor: 990,
              opposite: true
            }],
          tooltip: {
            formatter: function () {
              var s = this.x;

              s += '<br/>' + '<span style="color:#228B22;">' + this.points[2].series.name + '</span>' + ': ' +
                      this.points[2].y + '℃';
              s += '<br/>' + '<span style="color:#4169E1;">' + this.points[1].series.name + '</span>' + ': ' +
                      this.points[1].y + '%';
              s += '<br/>' + '<span style="color:#DAA520;">' + this.points[0].series.name + '</span>' + ': ' +
                      this.points[0].y + 'hPa';
              return s;
            },
            shared: true
          },

          exporting: {
            buttons: {
              customButton: {
                text: '昨日',
                onclick: function () {
                  alert('昨日');
                }
              },
              anotherButton: {
                text: '今日',
                onclick: function () {
                  alert('今日');
                }
              }
            }
          },
          legend: {
            layout: 'vertical',
            align: 'left',
            x: 80,
            verticalAlign: 'top',
            y: 35,
            floating: true,
            backgroundColor: (Highcharts.theme && Highcharts.theme.legendBackgroundColor) || '#FFFFFF'
          },
          series: [{
              name: '気圧',
              type: 'column',
              yAxis: 2,
              color: '#DAA520',
              data: [1016, 1016, 1015.9, 1015.5, 996.3, 1009.5, 1009.6, 1010.2, 1013.1, 1016.9, 1018.2, 1016.7, 1016, 1016, 1015.9, 1015.5, 1012.3, 1009.5, 995.6, 1010.2, 1013.1, 1000.9, 1018.2, 1016.7],
              legendIndex: 2,
              marker: {
                enabled: false
              },
              dashStyle: 'shortdot',
              tooltip: {
                valueSuffix: ' hPa'
              }
            }, {
              name: '湿度',
              type: 'spline',
              yAxis: 1,
              color: '#4169E1',
              data: [45.9, 71.5, 50.4, 50.2, 55.0, 60.0, 70.6, 60.5, 70.4, 63.1, 70.6, 54.4, 49.9, 71.5, 50.4, 50.2, 45.0, 50.0, 70.6, 60.5, 62.4, 50.1, 75.6, 54.4],
              legendIndex: 1,
              tooltip: {
                valueSuffix: ' %'
              }

            }, {
              name: '気温',
              type: 'spline',
              yAxis: 0,
              color: '#228B22',
              data: [7.0, 6.9, 9.5, 14.5, 18.2, 21.5, 25.2, 26.5, 23.3, 18.3, 13.9, 9.6, 7.0, 6.9, 9.5, 14.5, 18.2, 21.5, 25.2, 26.5, 23.3, 18.3, 13.9, 9.6],
              legendIndex: 0,
              tooltip: {
                valueSuffix: ' ℃'
              }
            }]
        };
//			var yesterday = "2016/07/29";
        console.log("start env!");

        var date = new Date();
        var year = date.getFullYear();
        var month = (1 + date.getMonth()).toString();
        month = month.length > 1 ? month : '0' + month;
        var day = date.getDate().toString();
        day = day.length > 1 ? day : '0' + day;
        var yesterday = year + '/' + month + '/' + day;
        console.log("start env1! : " + yesterday);

        var date = new Date();
        var year = date.getFullYear();
        var month = (1 + date.getMonth()).toString();
        month = month.length > 1 ? month : '0' + month;
        var day = date.getDate().toString();
        day = day.length > 1 ? day : '0' + day;
        var yesterday = year + '/' + month + '/' + day;

        $.getJSON("res.php", {"yesterday_date": yesterday}, function (data) {
          //console.log("start env2! : " + data[0] + " " + data[1] + " " + data[2]);
          //console.log("start env2! : " + data);
          options.series[2].data = data[0];
          options.series[1].data = data[1];
          options.series[0].data = data[2];
          var chart = new Highcharts.Chart(options);
        });
        console.log("start env3! : ");

      });
    </script>
  </head>
  <body>
    <ul id="container"></ul>
  </body>
</html>
getJSON関数により呼び出されるファイル「res.php」を次に示します。getJSON関数から渡されたパラメータは使用していません。固定値を戻り値にしています。
res.php
<?php

$userwork = array(
    array(
        11.0, 10.9, 9.5, 14.5, 18.2, 21.5, 25.2, 26.5, 23.3, 18.3, 13.9, 9.6, 7.0, 6.9, 9.5, 14.5, 18.2, 21.5, 25.2, 26.5, 23.3, 18.3, 13.9, 9.6),
    array(
        45.9, 71.5, 50.4, 50.2, 55.0, 60.0, 70.6, 60.5, 70.4, 63.1, 70.6, 54.4, 49.9, 71.5, 50.4, 50.2, 45.0, 50.0, 70.6, 60.5, 62.4, 50.1, 75.6, 54.4),
    array(
        1016, 1016, 1015.9, 1015.5, 996.3, 1009.5, 1009.6, 1010.2, 1013.1, 1016.9, 1018.2, 1016.7, 1016, 1016, 1015.9, 1015.5, 1012.3, 1009.5, 995.6, 1010.2, 1013.1, 1000.9, 1018.2, 1016.7)
);

header('Content-type: application/json; charset=UTF-8');
echo json_encode($userwork);
?>
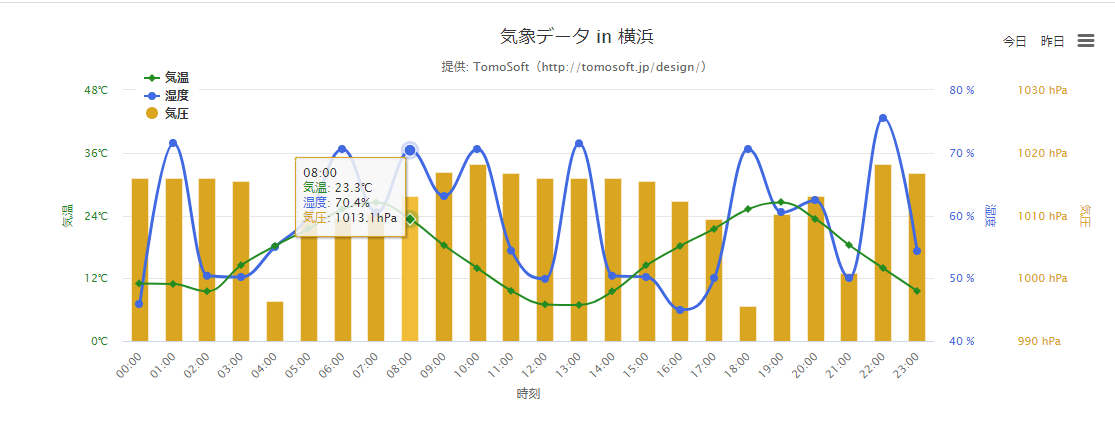
Highchartsを使ったチャートのコードの実行
ブラウザからURL「http://localhost/highcharts/」を入力すると、次のチャートが表示されます。