VisualStudio 2022を使って、C#(.NET Framework)でLiveCharts2により「RealTime Chart」を作成します。
アプリ作成の準備
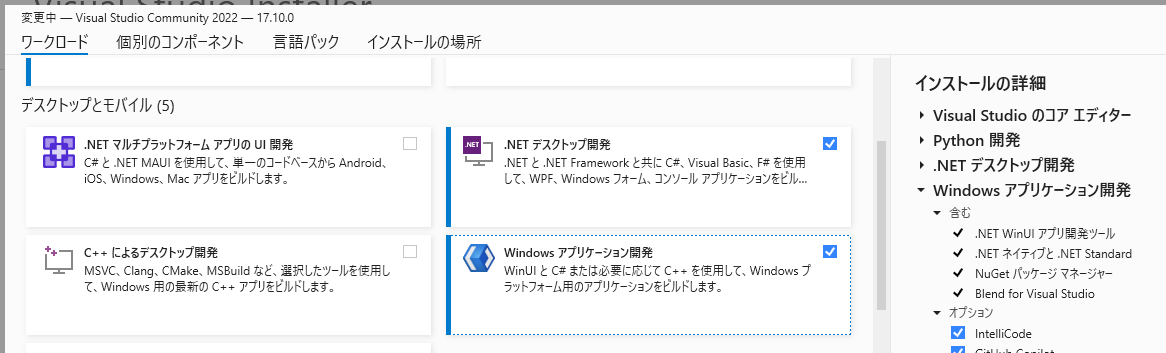
C#(.NET Framework)がインストールされていない場合、デスクトップとモバイルから「Windows アプリケーション開発」を選択します
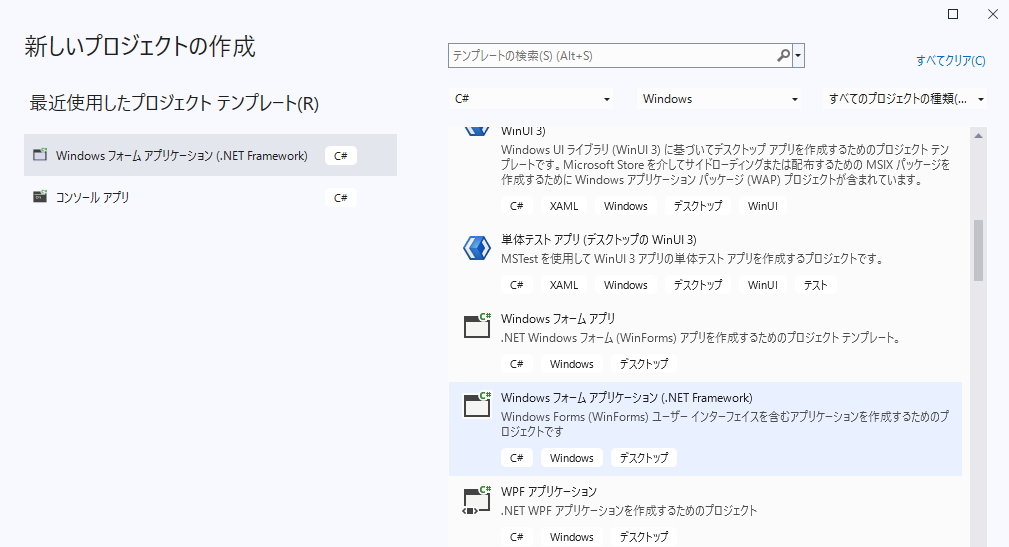
新規プロジェクトを作成するには、Windowsデスクトップのプロジェクトから「Windows フォームアプリケーション(.NET Framework)」を選択します。
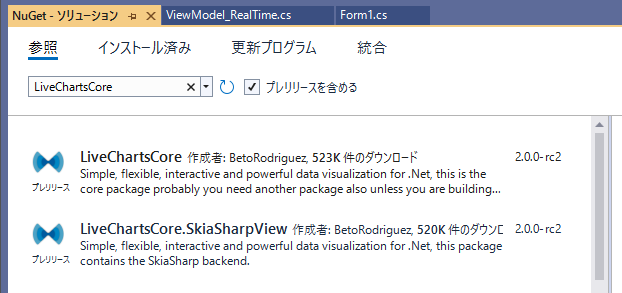
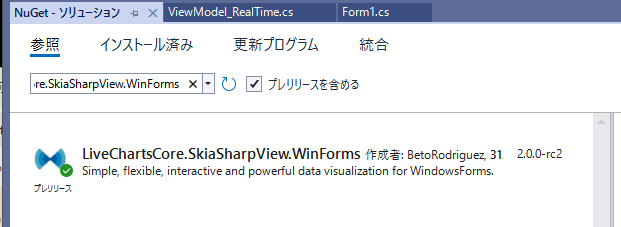
LiveCharts2を使用するために、「ツール」メニュー→「NuGet パッケージ マネージャー」から順に「LiveChartsCore」「LiveChartsCore.SkiaSharpView」「LiveChartsCore.SkiaSharpView.WinForms」を選択してインストールします。
RealTime Chartアプリの作成
「LiveCharts2 gallery」のサンプルを参考にして、次のようにRealTime Chartアプリを作成します。
LiveCharts2Test\Form1.cs
using LiveCharts2Test.VM;
using LiveChartsCore.SkiaSharpView.Painting;
using LiveChartsCore.SkiaSharpView.WinForms;
using SkiaSharp;
using System.Drawing;
using System.Windows.Forms;

namespace LiveCharts2Test
{
    public partial class Form1 : Form
    {
        private CartesianChart cartesianChart;

        public Form1()
        {
            InitializeComponent();
            InitializeRealTime();
        }
        private void InitializeRealTime()
        {
            Size = new System.Drawing.Size(1000, 1000);

            var viewModel = new ViewModel_RealTime();

            cartesianChart = new CartesianChart
            {
                SyncContext = viewModel.Sync,
                Series = viewModel.Series,
                XAxes = viewModel.XAxes,

                // out of livecharts properties...
                Location = new System.Drawing.Point(0, 0),
                Size = new System.Drawing.Size(1000, 1000),
                Anchor = AnchorStyles.Left | AnchorStyles.Right | AnchorStyles.Top | AnchorStyles.Bottom
            };

            Controls.Add(cartesianChart);

        }
    }
}
LiveCharts2Test\ViewModel_RealTime.cs
using LiveChartsCore;
using LiveChartsCore.Defaults;
using LiveChartsCore.SkiaSharpView;
using LiveChartsCore.SkiaSharpView.Painting;
using SkiaSharp;
using System;
using System.Collections.Generic;
using System.Collections.ObjectModel;
using System.Threading.Tasks;


namespace LiveCharts2Test.VM
{
    public partial class ViewModel_RealTime
    {
        private readonly Random _random = new Random();
        private readonly List<DateTimePoint> _values = new List<DateTimePoint>();
        private readonly DateTimeAxis _customAxis;

        public ViewModel_RealTime()
        {
            Series = new ObservableCollection<ISeries>
            {
                new LineSeries<DateTimePoint>
                {
                    Values = _values,
                    Fill = null,
                    GeometryFill = null,
                    GeometryStroke = null
                }
            };

            _customAxis = new DateTimeAxis(TimeSpan.FromSeconds(1), Formatter)
            {
                CustomSeparators = GetSeparators(),
                AnimationsSpeed = TimeSpan.FromMilliseconds(0),
                SeparatorsPaint = new SolidColorPaint(SKColors.Black.WithAlpha(100))
            };

            XAxes = new Axis[] { _customAxis };

            _ = ReadData();
        }
        public ObservableCollection<ISeries> Series { get; set; }

        public Axis[] XAxes { get; set; }

        public object Sync { get; } = new object();

        public bool IsReading { get; set; } = true;

        private async Task ReadData()
        {
            // to keep this sample simple, we run the next infinite loop
            // in a real application you should stop the loop/task when the view is disposed

            while (IsReading)
            {
                await Task.Delay(100);

                // Because we are updating the chart from a different thread
                // we need to use a lock to access the chart data.
                // this is not necessary if your changes are made in the UI thread.
                lock (Sync)
                {
                    _values.Add(new DateTimePoint(DateTime.Now, _random.Next(0, 10)));
                    if (_values.Count > 250) _values.RemoveAt(0);

                    // we need to update the separators every time we add a new point
                    _customAxis.CustomSeparators = GetSeparators();
                }
            }
        }

        private double[] GetSeparators()
        {
            var now = DateTime.Now;

            return new double[]
            {
            now.AddSeconds(-25).Ticks,
            now.AddSeconds(-20).Ticks,
            now.AddSeconds(-15).Ticks,
            now.AddSeconds(-10).Ticks,
            now.AddSeconds(-5).Ticks,
            now.Ticks
            };
        }

        private static string Formatter(DateTime date)
        {
            var secsAgo = (DateTime.Now - date).TotalSeconds;

            return secsAgo < 1
                ? "now"
                : $"{secsAgo:N0}s ago";
        }
    }
}
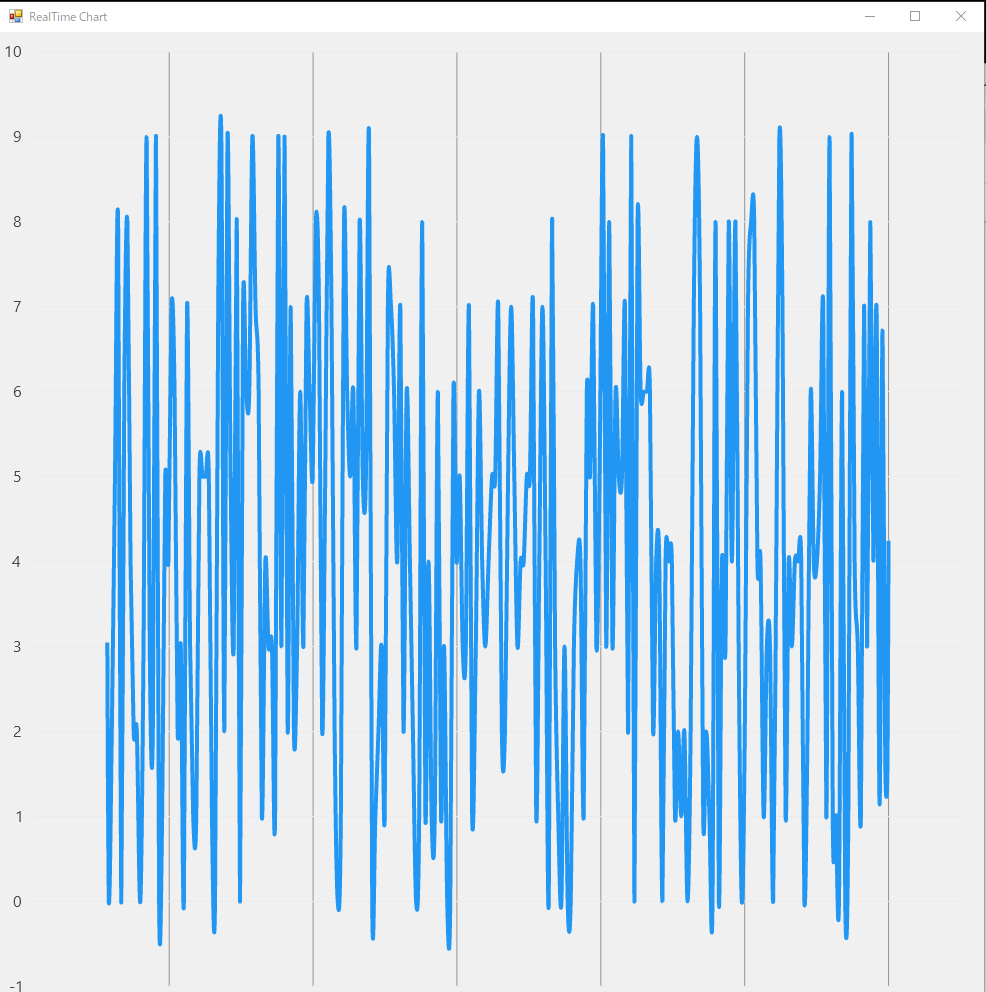
RealTime Chartアプリの実行
作成したRealTime Chartアプリを実行すると、次のようにランダムに発生したデータをグラフ化します。