Pythonのプロファイリング「cProfile」を使って、ざっくり関数レベルでどの関数でどれぐらい実行時間がかかっているかを調べます。
- 実行時間を計測するプログラム「TestTimeMeasurement.py」を次に示します。matplotlibライブラリを使ったグラフ表示プログラムとなります。
- 次のように実行します。main関数の実行時間が「1.0252997875213623[sec]」と表示されます。
- 次のように「 -m cProfile」を指定して実行します。
- 1行目
- 呼び出した関数の数と実行時間
- Ordered by
- 出力のソート方法
- ncalls
- 呼び出し回数
- tottime
- subfunctionの実行時間を除いた時間
- percall
- tottimeをncallsで割った値
- cumtime
- この関数とそのsubfuntionに消費された累積時間
- percall
- cumtimeを呼び出し回数で割った値。関数単位の実行時間
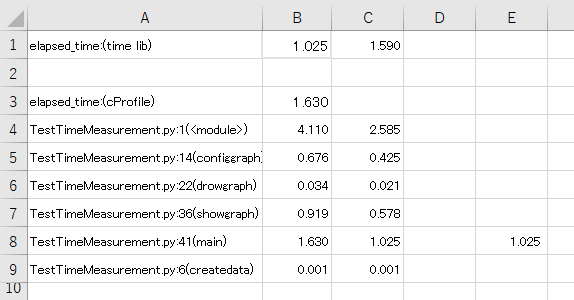
- time ライブラリでの実行時間を使って、cProfileで計測した実行時間を補正して各関数ごとの実行時間を計算すると、次のようになりました。
TestTimeMeasurement.py
import numpy as np
import matplotlib.pyplot as plt
import time


def createdata():
    x = np.linspace(-np.pi, np.pi, num=100, endpoint=True)
    y1 = np.sin(x)
    y2 = np.sin(x * 2)
    y3 = np.cos(x * 2)
    return x, y1, y2, y3


def configgraph():
    fig = plt.figure()
    ax1 = plt.axes([0.1, 0.3, 0.8, 0.6])
    ax2 = plt.axes([0.1, 0.1, 0.8, 0.2])
    ax3 = plt.axes([0.55, 0.35, 0.3, 0.2])
    return ax1, ax2, ax3


def drowgraph(ax1, ax2, ax3, x, y1, y2, y3):
    ax1.set_ylim(-1, 1)
    ax2.set_ylim(-1, 1)

    ax1.tick_params(labelbottom=False)
    ax2.tick_params(labelleft=False)

    ax3.set_title("cos 2x curve")

    ax1.plot(x, y1)
    ax2.plot(x, y2)
    ax3.plot(x, y3)


def showgraph():
    #plt.show()
    plt.pause(0.001)


def main():
    x, y1, y2, y3 = createdata()
    ax1, ax2, ax3 = configgraph()
    drowgraph(ax1, ax2, ax3, x, y1, y2, y3)
    showgraph()


if __name__ == "__main__":
    start = time.time()
    main()
    elapsed_time = time.time() - start
    print("elapsed_time:{0}".format(elapsed_time) + "[sec]")
$ python3 TestTimeMeasurement.py
elapsed_time:1.0252997875213623[sec]
$ sudo python3 -m cProfile TestTimeMeasurement.py > time-measurement-web
リダイレクトされたファイル「time-measurement-web」を開くと次のように表示されます。
elapsed_time:1.629910945892334[sec]
         1079732 function calls (1052970 primitive calls) in 4.106 seconds

   Ordered by: standard name

   ncalls  tottime  percall  cumtime  percall filename:lineno(function)
           ...
        1    0.000    0.000    4.110    4.110 TestTimeMeasurement.py:1()
        1    0.000    0.000    0.676    0.676 TestTimeMeasurement.py:14(configgraph)
        1    0.000    0.000    0.034    0.034 TestTimeMeasurement.py:22(drowgraph)
        1    0.000    0.000    0.919    0.919 TestTimeMeasurement.py:36(showgraph)
        1    0.000    0.000    1.630    1.630 TestTimeMeasurement.py:41(main)
        1    0.000    0.000    0.001    0.001 TestTimeMeasurement.py:6(createdata)
           ...

           ※時間の単位:秒